
Oct 2025
Kinematic Analysis of a Prosthetic Leg Transmission

Left: photo of prototype transmission with stickers for video tracking. Top right: plot of trajectories for certain points. Bottom right: kinematic model² of the transmission.
A major part of my involvement in Alberta Bionix¹ has been developing a way to compare the kinematics of our 3D-printed prototype prosthetic leg transmission to its intended ideal behaviour.
In order to achieve this, myself and a collaborator used various software tools including Tracker (video point tracking), Linkage (mechanism simulator), and Python (data processing and plotting using matplotlib and pandas).
This project was an enjoyable blend of mechanical design and software work, giving me the chance to apply coding and data processing skills to a physical design problem.
¹ This work will be presented at the 2025 AB BME Conference.
² This kinematic model is adapted from the Utah Bionic Leg paper upon which the Alberta Bionix leg is based.
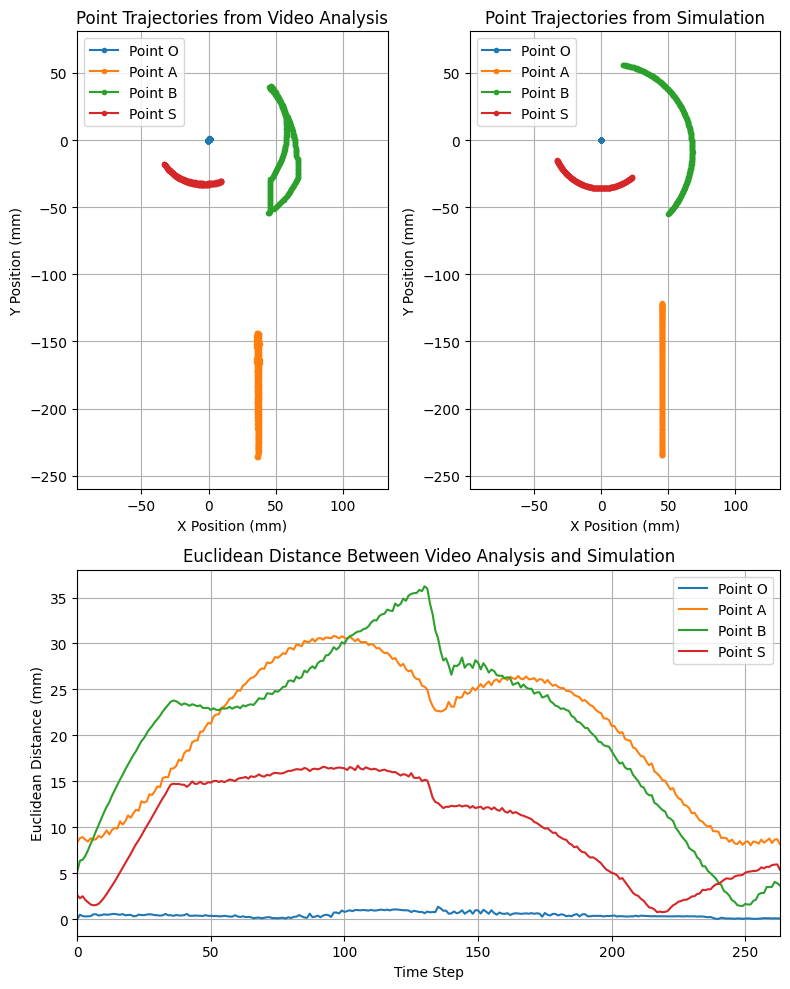

Left: screenshot of the prototype transmission video inside the Tracker video analysis software. Right: Three plots that compare the behaviour of the prototype transmission and a simulated transmission.
For the video analysis, blue stickers were applied at various locations, and the prototype was placed on a uniform black surface to help improve contrast to make Tracker’s automatic tracking more accurate.
The results are three figures:
Trajectories of specific points through the whole range of motion of the 3D-printed prototype transmission.
Trajectories of specific points from the simulated transmission.
Plot of the Euclidean distance (L2 norm) between specific points over time.
The information from this work will guide future design and manufacturing decisions.